
Recycling is one of the critical factors to help us prevent climate change. So, keeping the most recent recycling statistics in mind is crucial.
Now, some of the benefits of recycling include conserving natural resources like water and wood, decreasing the areas, costs, and risks of landfills, saving energy, and providing a domestic source of materials. It even helps create jobs in the US, according to stats about recycling.
Would you like to find out more?
Let’s dive right in with some…
Top Recycling Stats: Editor’s Choice
- In 2017, the total generation of municipal solid waste in the US was 267.8 million tons.
- There were 2.68 pounds of generated MSW daily per capita in 1960, compared to4.51 pounds in 2017.
- EU countries have targeted a 65% recycling rate by 2030.
- At this rate, the US will run out of room in landfills in the next 18 years.
- 70% of all corrugated cardboard is recovered for recycling.
- Only 1% of plastic bags in the US are returned for recycling.
- 75% of aluminum ever made is still in use today.
- Almost 100% of spent lead batteries in the US are recycled.
- The US is generating more than 30% of the planet’s total trash.
General Recycling Facts and Statistics
1. In 2017, the total generation of municipal solid waste in the US was 267.8 million tons.
According to the latest data, from 2017, the total generation of municipal solid waste was 267.8 million tons, or, on average, 4.51 pounds per person every day. Out of this, around 67 million tons were recycled and 27 million tons were composted.
2. 139 million tons or 52.1% of MSW were landfilled in the US in 2017.
According to the recycling facts, around 94 million tons were recycled or composted, which amounts to around 35.2%.
Additionally, 34 million tons or 12.7% were combusted with energy recovery, which means that more than 139 million tons or 52.1% were landfilled.
3. 4.74 pounds of MSW generated by capita daily in 2000, compared to 4.51 pounds in 2017.
The total generation in 2017 was around 5.7 million tons more than the amount for 2015, since the total amount generated in 2015 was 262.1 million tons, compared to 208.3 million tons in 1990.
According to the US recycling stats in 2015, MSW generation per person was 4.48 pounds a day and just under 4.51 pounds a day in 2017.
This is one of the lowest estimates since 1990. MSW generation per person was the highest in 2000 with 4.74 pounds per person daily.
4. 25.1% of all the MSW generated in 2017 was recycled, and 10.1% was composted.
Out of all the MSW generated in 2017, 67.2 million tons were recycled, or 25.1%. According to recycling statistics, in America, paper and paperboard accounted for almost two-thirds of that amount.
The rest was metal with around 12% and glass, plastic, and wood with 4-5%.
An additional 27 million tons or 10.1% was composted, with the yard trimmings leading the way with 24.4 million tons, over 5 times more than in 1990. Good waste made up the remaining 2.6 billion tons.
5. With 28.8 tons the corrugated boxes were the most recycled and composted product.
As for the composted products that are being most recycled and composted, facts on recycling show that corrugated boxes led the way with 28.8 million tons, followed by yard trimmings with 24.4 million.
Mixed nondurable paper products accounted for 9.9 million tons, newspapers and mechanical papers accounted for 4.2 million tons, followed by lead-acid batteries with 3.2 million tons.
6. 22% of landfilled MSW was food, and 19% was plastics.
Paper and paperboard came next with 13%, followed by rubber, leather, and textiles with 11%. Other materials participated with less than 10%.
7. 22% of MSW combusted with energy recovery was food.
Recycle stats about the amount of MSW combusted with energy recovery reveal that in 2017, 34 million tons or 12.7% of MSW was combusted.
As for the products, food is again leading the way with 22%, followed by rubber, leather, and textiles with just over 16%, around the same amount as plastics.
Paper and paperboard accounted for around 13%, and other materials participated with less than 10%.
8. 88.1 million tons of MSW were generated in 1960, more than 3x less than in 2017.
US recycling statistics suggest there has been a great change in the amount of the generated MSW and recycling and disposal.
In 1960, when it was measured for the first time, the figure stood at 88.1 million tons, more than three times less than in 2017.
There was a slight decrease of 1% between 2005 and 2010, but it increased again in the last decade by 7%.
9. 2.68 pounds of MSW per capita were generated daily in 1960, compared to 4.51 pounds in 2017.
If we focus on the garbage and recycling facts, we’ll see the figure grew consistently between 1960 and 2005. In 1980, it was 3.66 pounds a day, and the peak was in 2000 at 4.74 pounds a day.
In 2005 it decreased to 4.59 pounds, and in 2017, the last time it was measured, it was 4.51 pounds, which is one of the best results since 1990.
10. Only 6% of generated MSW was recycled in 1960, compared to over 35% in 2017.
One of the more encouraging recycling facts is the growth of recycling rates over the years. In 1960, just 6% of generated MSW was recycled. In 1980, this number rose to 10%, and to 16% in 1990.
The biggest surge is seen in 2000 with around 29% of generated MSW. For comparison, in 2017 it was more than 35%.
11. 94% of generated MSW in 1960 was landfilled, compared to 52% in 2017.
As for the amount of MSW combusted with energy recovery, it did not even exist in 1960. In 1990 14% of MSW was combusted, the highest number up to now. In 2017 it was just over 12%.
Recycling facts about landfills from history are showing that a staggering 94% of generated MSW was landfilled in 1960, compared to around 52% in 2017.
12. Vermont is the greenest state in the US by cumulative scores.
If we break down recycling statistics by state, according to the percentage of recycling and using solar power, Vermont is in the lead, followed by Massachusetts, Oregon, Washington, and Connecticut. I
f we look at recycling statistics by state by category, New York is leading the way for the lowest gasoline consumption and lowest energy consumption per capita.
Missouri’s claim to fame is the lowest total municipal solid waste per capita.
13. 4.1 tons of waste is generated by a person yearly in Idaho, compared to 38.4 tons in Nevada.
Idaho is leading the way in this category with only 4.1 tons of waste generated by a person, followed by North Dakota with 5.2 tons and Connecticut with 7.3 tons.
According to statistics on recycling, Nevada is the worst with 38.4 tons per person, followed by Pennsylvania, Colorado, and California with 35 tons per person or slightly over.
14. Germany has the highest recycling rate with 56.1%.
If we take a look at a global perspective, the leading country in the world for the recycling rate is Germany with an amazing 56.1%. The second place is reserved for Austria with 53.8%.
The leading countries are recycling between 52% and 56% of their MSW, with Switzerland recycling nearly 50%.
15. EU countries are targeting a 65% recycling rate targeted for 2030.
In Australia, 51% of household waste is recycled, pretty much like in leading European countries. According to global recycling statistics, this is higher than the average recycling rate in the EU, which is 42%.
The EU is adopting a new target for 2030, targeting 65% of the recycling rate for all member states.
16. Only 18% of college students have a strong grip on the concept of sustainability.
Washington, DC’s American University has a goal to be 100% waste-free. This zero-waste policy was adopted in 2010, and it has reached some significant milestones.
One of the main goals is for all university waste to be diverted from landfills.
According to the recycling on college campuses statistics, in 2015, 86.4% of students had heard of sustainability, but only 35% of them felt they knew what it really meant, and only 18% felt like they have a strong grip on the concept.
Sometimes people do not recycle because they think it is a very complicated process, and they decide to keep out of it.
Landfill Statistics
17. There are currently over 3,000 active landfills in the US and over 10,000 old landfills.
This is a huge number and a huge risk of creating hazardous gas. It could also be a danger to the waters. Depending on the report, Americans generate between 250 and 400 million tons of garbage every year.
And all this trash needs to be put somewhere.
18. Almost 1,200 pounds of waste paper could be composted and kept out of landfills.
Garbage facts are showing that an average American is throwing away almost 1,200 pounds of waste every year that can be composted and kept out of landfills.
Recent statistics are showing that landfills are filling up with around 40-50% of paper waste products.
Another product that is taking up a lot of space is plastic bags. It is estimated that around 380 billion single-use plastic bags are disposed of every year in the US.
Reducing these numbers would lead to a decrease in the needed landfill space.
19. Communities in the US spend 2-4 million dollars on creating a landfill.
Waste disposal facts suggest that most communities in the US are spending big to create a landfill. It’s a very complicated task since it should be a carefully designed structure, built on top of the ground and isolated from the environment.
20. Every ton of paper recycled saves 3 cubic yards of landfill space.
Although the recycling rate in the US is slowly increasing, so is consumption. At this rate, according to waste management facts, recycling is only enough to retain the status quo.
For better results, the reduction of consumption is necessary.
Additionally, plastic bottles and bags that take up a large percentage of landfills take up to 1000 years to degrade because they are shielded from the sun and can produce methane, which is very dangerous.
21. It costs 55.36 dollars on average for a ton of waste to end up in landfills in the US.
According to recycling statistics, the average price for one ton of trash to go to the landfill is 55.36 dollars.
The West Coast region is the most expensive since the price there are 73.03 dollars per ton, followed by the Northeast with 66.53 dollars per ton.
We have a better situation in the Mountains/Plains region with 50.71 dollars per ton, while the Midwest has the best price with 48.87 dollars per ton.
22. At this rate, the US will run out of room in landfills in the next 18 years.
Garbage facts reveal that at this rate, the US will run out of room in landfills in the next 18 years, which could create an environmental disaster.
The Northeast region is running out of landfill space the fastest, while the Western states have the most remaining space.
23. The US burns 33 million tons of waste each year, but that figure could be much bigger.
One way of dealing with the massive amounts of trash in landfills is burning the trash for energy. Currently, according to the recycling facts for 2019 by EPA, the US burns around 33 million tons of waste each year.
This is a good way to deal with trash, as shown by Sweden, which burns around 50% of its solid waste and has developed systems for emission reduction.
Composting
24. 27 million tons of MSW were composted in 2017.
This figure includes 24.4 million tons of yard trimmings and 2.6 million tons of food waste.
According to recycling and composting facts, by tonnage, the most recycled or composted products and materials were corrugated boxes with 28.8 million tons, followed by yard trimmings.
Then come mixed nondurable paper products with 9.9 million tons, newspaper and mechanical papers with 4.2 million tones, lead-acid batteries with 3.2 million tons, major appliances with 3.1 million tons, glass containers, and wood packaging with 3 million tons each, tires and with 2.6 million tons each, and selected consumer electronics with 1 million tons.
An interesting fact about recycling and composting is that combined, these products account for 92% of total MSW recycling and composting.
25. 6.3% of wasted food in 2017 was composted.
As for the composting of food, the good news is that it rose from 1.84 million tons in 2013, which was 5% of food, to 2.6 million tons or 6.3% of food in 2017.
In 2017, the US recovered over 67 million tons of MSW through recycling, and the United States recycling statistics show that almost 27 million tons of MSW were recovered through composting.
This amounts to 1.13 pounds per person for recycling and 0.45 pounds per person per day for composting.
26. 6.1 million households were served by food composting curbside collection programs in 2017.
Food composting is very useful, and it should be much more prevalent. The amount of food wasted could feed millions of hungry or homeless people.
At least one fun composting and recycling fact about this much food waste is that food composting curbside collection programs in the US in 2017 served 6.1 million households.
Paper Recycling Facts
27. Paper recovery in the US reached an all-time high in 2018 with 68.1%.
That was an increase of 2.2% from 2017 and 0.9% from 2016. According to paper recycling stats, the main factor for this development was a 2.7% increase in domestic mill consumption of recovered paper and a 4.2% increase in recovered paper exports.
For comparison, in 1990, when the American Forest and Paper Association set its recovery goals, the paper recovery rate was only 33.5%. The goal set for 2020 is more than 70%.
28. 21.3 million tons of paper went to landfills in 2018, compared to 33 million tons in 2008
This decrease is due to a rise in the paper recovery rate over the years, recycling paper facts reveal. Besides recycling, some paper is disposed of via incineration with energy recovery, and bathroom tissue is disposed of via the sewer system.
29. 36.2% of recycled paper was used to produce containerboard.
As for where the recycled paper is used, facts about recycling paper show that in 2018, 36.2% of the recovered paper and paperboard went to produce containerboard, the type of material used for corrugated boxes, and 11.5% went to the production of boxboard, like base stock for folding boxes.
Paper recycling is also very useful for economics, as 38.3% of the total net exports of paper were the paper collected for recycling in the US, a slight increase from 37.7% in 2017.
30. 66.2% newsprint and mechanical papers recovery rate in 2018, a decrease from 77.3% in 2017.
According to recycling paper stats, paper and paperboard packaging represent more than 75% of packaging materials that are recovered for recycling in the US.
As for the recovery of newsprint and mechanical papers, there was a significant decrease in 2018 with a 66.2% recovery rate compared to a 77.3% of recovery rate in 2017.
This decrease is caused mainly by a 30.1% drop in net exports because the consumption of ONP at domestic mills decreased by only 3.3% in 2018.
31. Businesses in the US use 21 million tons of paper every year.
Paper recycling facts show that Americans use a lot of paper, on average 650 pounds of paper a year per person. As for businesses, they use around 21 million tons of paper every year.
There is a symptomatic rise in the production of waste during the holidays.
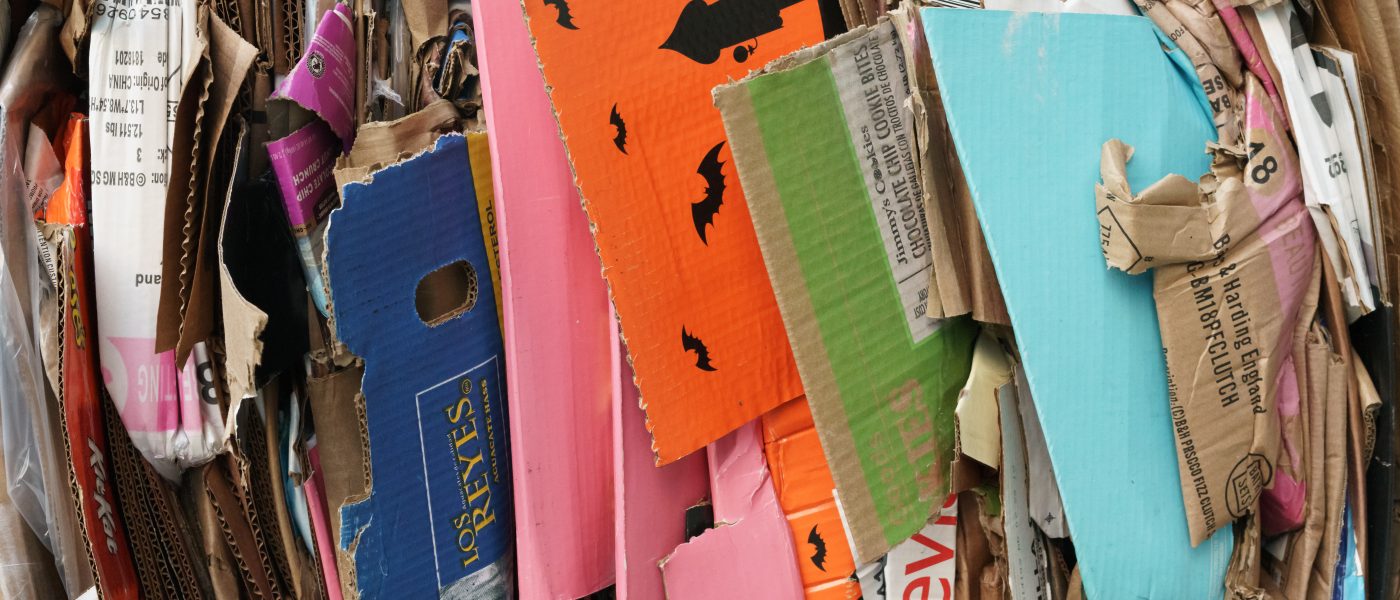
32. 70% of all corrugated cardboard is recovered for recycling.
As for the cardboard recycling facts, they are encouraging and represent a successful recycling story since 70% of all corrugated cardboard is recovered for recycling, which makes it the largest source of waste paper.
This is very important due to the fact that over 90% of all shipped products in the US are shipped in corrugated boxes, which amounts to 400 billion square feet of cardboard.
It’s a 17 billion-per-year industry, the largest segment of the packaging industry.
33. 46 gallons of oil are saved by recycling 1 ton of cardboard.
It seems like cool recycling facts are mostly oriented towards cardboard since it has a very high recycling rate.
This is due to the fact that many businesses and many homes are recycling cardboard. One of the best examples is Iowa’s grocery industry, which recycles around 500,000 tons of cardboard every year.

Plastic Recycling Facts
34. 75.4% of plastic material generated MSW went to landfills in 2015.
Recycling plastic facts show plastic is one of the toughest enemies of the environment because it can take up to 500 years for a plastic item to decompose in landfills.
Because of that plastic recycling is very important, especially if we know that in 2015 only 9.1% of plastic material generated MSW was recycled.
In addition, 15.5% was combusted for energy, and a whopping 75.4% went to landfills.
35. In 2014, 45% of global recycled plastics were recycled in the US.
Plastic waste stats indicate that recycling plastic can result in significant energy savings compared to energy use for the production of new plastics using virgin material, which is another advantage.
Although the US could recycle more plastic, recycling facts for plastic reveal it is still leading the race with 3.5 million tons of post-industrial and post-consumer plastic scrap recycled in 2014, which was around 45% of the total 7.7 million tonnes.
36. In 2017 8.4% of the total plastics generated were recycled.
In 2017 the US generated 35.37 million tons of virgin plastics. This means the overall production of plastics went up. On the other side, the recycling total decreased to 2.96 million tons or 8.4% of the total.
37. It takes 2x more energy to burn plastic than to recycle it.
Recycling facts for plastic show recycling plastic is very useful and has many advantages. And only one recycled plastic bottle can save enough energy to run a 100-watt bulb for 4 hours.
What’s more, it creates 20% less air pollution and 50% less water pollution than would be created if we were making a new bottle from virgin plastics.
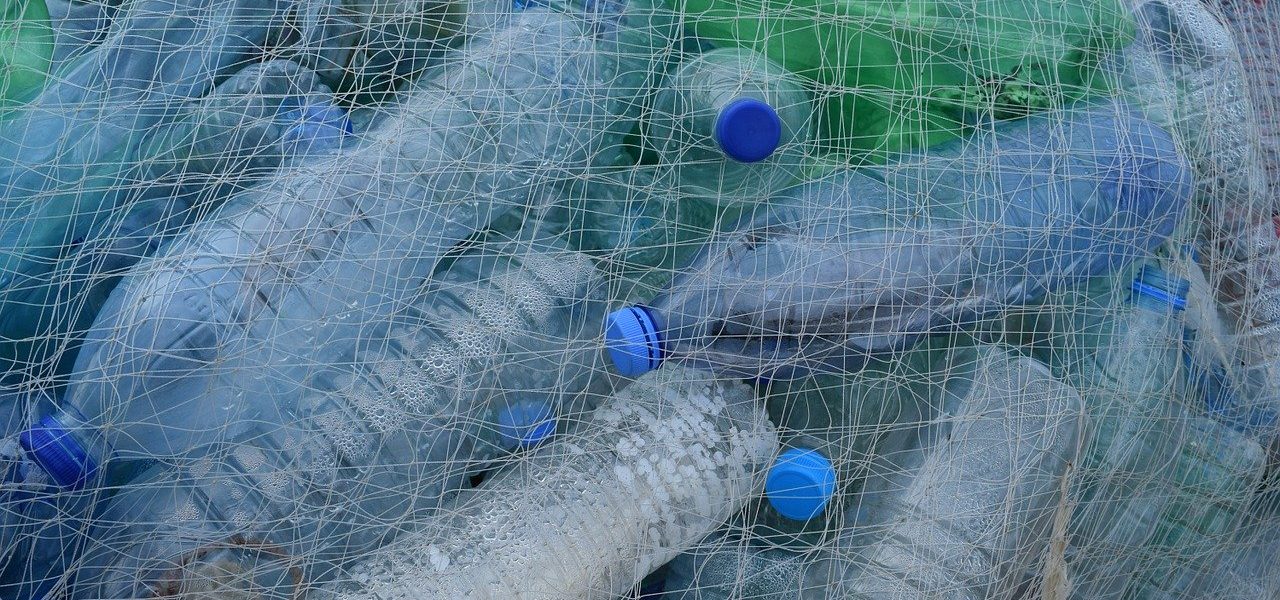
38. Only 1% of plastic bags in the US are returned for recycling.
In one of the more unnerving facts about recycling plastic bags, Americans use around 100 billion plastic bags a year. It takes 12 million barrels of oil to make that many plastic bags.
That is a huge number since it takes the energy required to make only 14 plastic bags to drive one mile.
Every family in America on average takes 1,500 plastic bags home a year. And for recycling, merely 1% of plastic bags are returned for recycling, with the rest is going to landfills.
39. 127 countries have taxed or banned plastic bags.
Plastic bag recycling facts show the cost of recycling 1 ton of plastic bags is 4,000 dollars. By selling the product you get just 32 dollars, so recycling is not a viable option for plastic bags.
According to the UN, 127 countries taxed or banned plastic bags because the average time of use for a plastic bag is just 15 minutes, and it takes from 20 to 1000 years for a plastic bag to break up, depending on the type of plastic.
The US alone is responsible for around 327 billion plastic bags that end up in the oceans.
40. The recycling rate for PET bottles was 29.1% in 2017.
According to facts about recycling plastic in 2015, about 30% of recyclable plastic bottles and jars were recycled. Every year in the US, around 2.4 million tons of PET plastic are discarded.
Water bottles make up between 26% and 41% of this.
Although the overall amount of recycled plastics is just 8.4%, there are some specific types of plastic containers at a higher rate.
For example, the recycling rate of PET bottles and jars was 29.1% in 2017, and the rate for HDPE natural bottles was 31.2% in 2017.
41. 1 million plastic water bottles are sold every minute globally.
If we are talking about plastic water bottle recycling facts, two of them are very scary. Every minute humans around the world are buying a billion plastic water bottles. And 91% of them are not recycled.
The expectations for 2020 go as far as a trillion plastic bottles sold. Based on current projections, landfills can expect to receive around 12 billion metric tons of plastic by 2050, so it is a definitely big problem.
42. 118 million pounds of Styrofoam were recycled in 2016.
If we shift our focus to Styrofoam recycling facts, back in 2006, around 56 million pounds were recycled, which was around 10-12% of the Styrofoam used every year.
Not many recycling programs or centers accept it. But, according to the information from the Alliance of Foam Packaging Recyclers, in 2016 more than 118 million pounds of Styrofoam were recycled.
This includes 63 million pounds of post-consumer packaging and 55.7 million pounds of post-industrial recovery.
43. 63 million pounds of post-consumer and post-industrial Styrofoam were recycled in 2016.
Recycling statistics suggest there is a steady increase in the recycling of post-consumer and post-commercial Styrofoam, culminating with 63 million pounds recycled in 2016.
This is a significant increase from 2012 when 36.7 million pounds were recycled. For comparison, in 2004, there were 25 million pounds recycled, so we are definitely moving in the right direction.
44. Styrofoam is less than 1% of the total MSW stream by weight and volume.
This recycles rate of post-consumer and post-industrial EPS is one of the highest for all kinds of plastics. In the last 15 years, 19% of post-consumer and 25% of post-industrial Styrofoam is recycled globally.
One of the amazing facts about recycling Styrofoam is that it only represents less than 1% of the total MSW stream by weight and volume because it is mostly comprised of air.
According to the data from 2013, over half of Styrofoam recovered for recycling was used in order to produce recycled content packaging.
These numbers should be higher by now since there is a global shift in packaging ideas.
Metal Recycling Facts
Scrap metal recycling is the process of the recovery and processing of scrap metal from products or structures which are no longer in use. This way, we get the raw material we can use for new products. So, we are lowering our carbon footprint and using resources more efficiently.
45. Ferrous metals comprise 7.1% of the total MSW generation.
In 2017, the generation of ferrous metals, according to the statistics about recycling, was 18.9 million tons. The recycling rate of all materials in appliances, including ferrous metals, was just above 60%.
Additionally, the recycling rate of ferrous metals obtained from large and small appliances, furniture, and tires was 27.8%, or 4.7 million tons.
46. 1.1 million tons of steel cans were recycled in 2017.
The recycling rate for steel cans in 2017 was around 71%. Moreover, according to some steel recycling facts, there were 420,000 tons of other steel packages like strapping, crowns, and drums.
47. 2.3 million tons of MSW ferrous metals were combusted in 2017.
This figure represents 6.7% of all MSW combusted with energy recovery that year. According to recycling stats, 10.4 million tons of steel ended in landfills in 2017, or 7.5% of all MSW landfilled.
48. 75% of aluminum ever made is still in use today.
Aluminum is one of the best and most worthy metals to recycle. The reason for that is the fact that it’s infinitely recyclable. What’s more, aluminum has a quality to be 100% recyclable and does not lose any of its quality.
One of the interesting aluminum recycling facts is that this metal is one of the rare materials in the disposed stream that pays more for the cost of its collection.
49. 700 million dollars worth of aluminum cans are thrown away by Americans every year.
Aluminum may be the most recyclable of all materials. Discarded aluminum is the most valuable item in any recycling bin, but it seems that this is not a widely known fact.
According to aluminum recycling facts, Americans are throwing away more than 700 million dollars worth of aluminum cans every year.
This is wasting great opportunities since the aluminum industry is spending more than 800 million dollars a year on recycled cans.
Glass Recycling Facts
50. 4.2% of the total MSW generation in 2017 was glass.
In 2017, there were 11.4 million tons of glass MSW generation in the US, or 4.2% of the total MSW generation.
As for the recycled glass containers, in 2017, there were 3 million tons of recycled glass containers, which makes for a recycling rate of 26.6%.
51. 7 million tons of glass ended up in landfills in 2017.
Glass recycling facts are stating that there were 1.5 million tons of combusted glass in 2017, which was 4.3% of all MSW combustion with energy recovery that year.
As for glass that ended up in landfills, there were around 7 million tons in 2017, or 4.9% of all MSW landfilled.
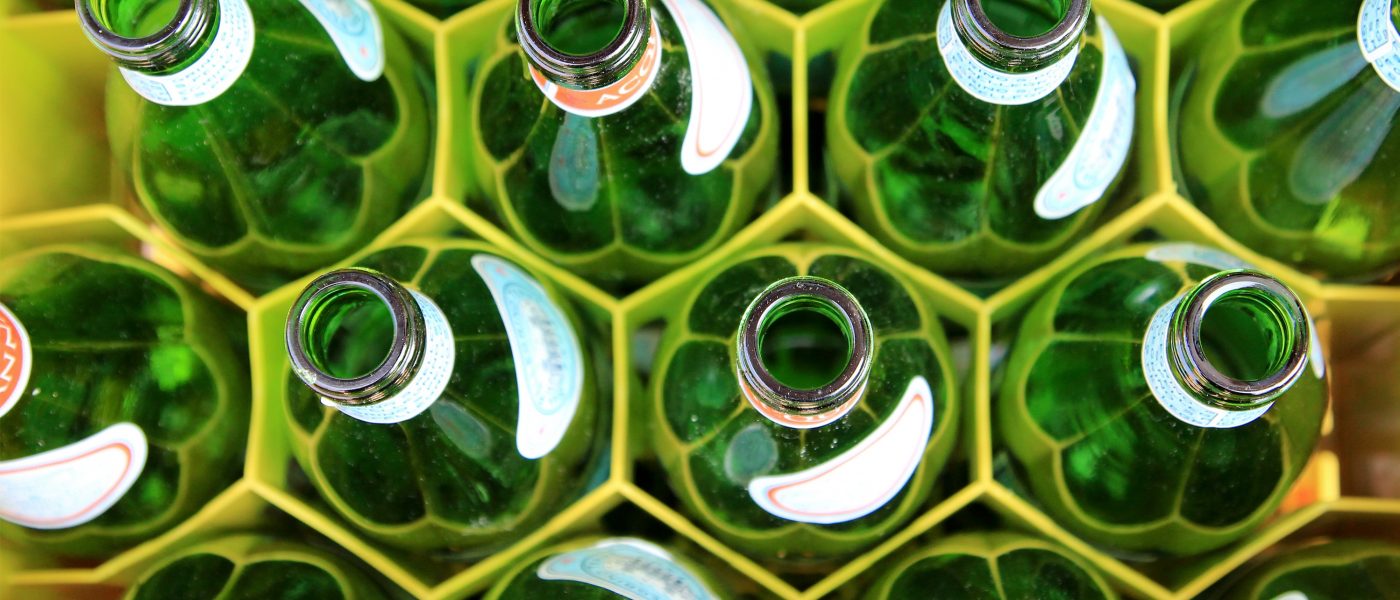
52. The glass recycling rate in the US is 33%, compared to over 90% in some European countries.
Recycling glass facts show that over 41% of beer and soft drink bottles were recovered for recycling in 2013, followed by 34.5% of wine and spirit bottles and 15% of other glass jars. This amounts to 34% of glass containers recycled.
53. 63% is the return rate of glass beverage containers in countries with beverage return deposit legislation, compared to 24% in countries without it.
Beverage return deposit legislation proved to be very efficient for glass beverage containers according to statistics for recycling.
The states with said legislation reported an average of 63% return rate, compared to just 24% for the states without this.
Electronics, Computers, and Batteries Recycling Facts
54. 80% of e-waste ends up in landfills.
Electronic equipment which is not used anymore, like laptops, phones, TVs, fridges, etc., is referred to as electronic or e-waste.
It represents a growing challenge, since the ICT industry is also growing, and the rate is very challenging.
According to recycling electronics facts, the vast majority of e-waste is sent to landfills, buried, or illegally traded.
E-waste is more dangerous than other types of waste since it contains hazardous materials for humans and the environment, like mercury, lead, and cadmium.
This is why ITU Member states agreed to a global goal of a 30% recycling rate of e-waste by 2023 and more than 50% for countries to have e-waste legislation.
Another goal, this one set for 2030, is to reduce the volume of redundant e-waste by 50%.
55. 70% of overall toxic waste comes from e-waste.
Stats on recycling are showing that there were 2.37 million tons of discarded computers, TVs, printers, fax machines, scanners, keyboards, and cell phones in 2009.
Out of all trash in landfills in America, e-waste amounts to around 2%. While this does not seem like much, we must not forget that 70% of overall toxic waste comes from e-waste.
56. 60 million dollars worth of gold and silver are thrown away every year by discarded mobile phones.
If we look globally, around 20 to 50 million metric tons of e-waste are disposed of around the world each year, without a chance to recycle some of the materials used in manufacturing.
Mobile phones have silver and gold in them, and one of the interesting recycling facts is that Americans are throwing away mobile phones with around 60 million dollars worth of silver and gold in them every year!
For one million cell phones recycled, it is possible to recover around 35,274 pounds of copper, 772 pounds of silver, 75 pounds of gold, and 33 pounds of palladium. At this stage, only 12.5% of e-waste is recycled.
But in many cases, what is labeled as e-waste is not waste at all but a piece of electronic equipment ready for reuse or recycling for materials recovery.
57. 60% of disposed computers in 2010 ended up in landfills.
As for the computer recycling facts, 71.7 million new desktop and laptop computers were purchased in the US in 2010. That same year, 423,000 tons of computers were disposed of.
According to the EPA’s most recent report about e-waste, Americans get rid of around 142,000 computers and 416,000 mobile devices every day.
58. Only 40% of disposed computers and 33% of disposed monitors were recycled.
Facts about recycling reveal that only around 168,000 tons disposed of computers are recycled. Besides computers, monitors are an important factor, since their recycling rate was just 33% or 194,000 tons out of a total of 595,000 tons.
These numbers are huge if we keep in mind that one metric ton of electronic scrap from personal computers has more gold in it than the amount of gold recovered from 17 tons of gold ore.
59. 81% of the life cycle energy use of a computer was used in production.
Another fun fact about recycling computers is that the majority of the complete energy usage of a computer with a 17-inch monitor for its complete life cycle was used during the manufacturing of the computer.
Unlike other home appliances, 81% of life cycle energy use was used for production, while only 19% was used for the operation.
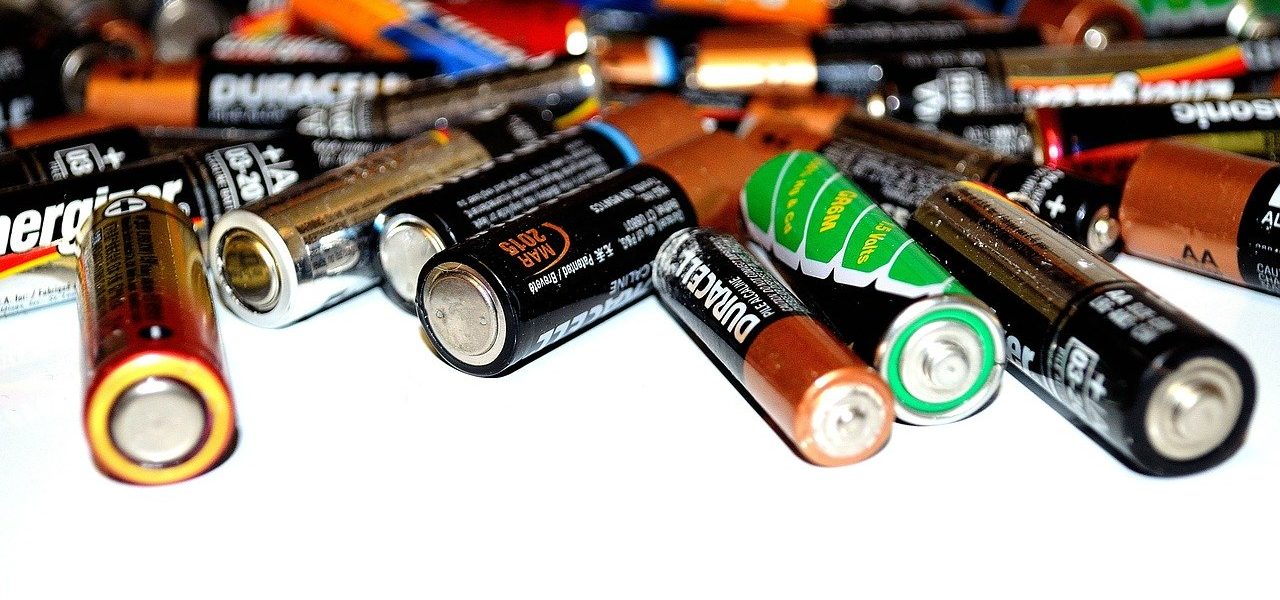
60. 3 billion dry-cell batteries are bought in the US every year, and around the same amount are disposed of.
As for recycling batteries facts, Americans are buying almost three billion dry-cell batteries every year. They are used to power toys, radios, mobile phones, laptops, etc.
But, at the same time, according to the EPA, every year Americans also dispose of more than three billion batteries.
This amounts to 180,000 tons of batteries. Out of them, around 86,000 tons are single-use alkaline batteries.
61. Around 100,000 tons of lithium-ion batteries are recycled globally, much more than previously thought.
One of the good facts about recycling is that the figure of 5% recycling rate for lithium-ion batteries was proven to be largely understated.
According to new studies, almost 100,000 tons of waste batteries were recycled globally last year.
This accounts for about 50% of batteries that reached the end of use. 67,000 of them were recycled in China and 18,000 in South Korea.
62. Almost 100% of spent lead batteries in the US are recycled.
The situation seems even brighter when we look at lead batteries, as nearly all of them are recycled.
An interesting statistic about recycling is that more than 129 million lead batteries did not go to landfills, thanks to recycling. Any new lead battery most often is comprised of more than 80% of recycled material.
63. The global electric vehicle battery recycling market is expected to reach a value of 2,272.3 million by 2025.
The global electric vehicle battery recycling market is one of the fastest-growing markets.
In 2017 it was valued at 138.6 million, and according to projections, it should reach 2,272.3 million by 2025. The growth rate between 2018 and 2025 is expected to be 41.8%.
Textile Recycling Facts
64. 85% of post-consumer textile waste ends up in landfills.
Textile waste occupies almost 5% of all landfill space. According to the EPA, every year 3.8 billion pounds of post-consumer textile waste is recycled.
But still, it is only 15% of total post-consumer textile waste, which means that 85% of it ends up in landfills.
65. 16.9 million tons of textile was generated in the MSW in 2017.
In 2017 the recycling rate for all textiles was 15.2%, with 2.6 million tons being recycled, according to the EPA recycling statistics.
The rate for textiles in clothing and footwear was 13.6%, and the rate for items like sheets and pillowcases was 16.3% in 2017.
16.9 million tons of textile were generated in the MSW in 2017, which makes up around 6.3% of the total MSW for that year.
66. 11.2 million tons of MSW textiles ended up in landfills in 2017.
According to the recycling in the US statistics in 2017, 3.2 million tons of textile in MSW were combusted, which amounted to 9.3%.
As for landfills, they received 11.2 million tons of MSW textiles in 2017, which was 8% of all MSW landfilled.
Tires Recycling Facts
67. 80% of discarded tires in the US are reused or recycled in some way.
According to the data from the EPA and Rubber Manufacturers Association, every year around 290 million tires are discarded in the US.
Recycling tire facts reveal that around 233 million tires are reused or recycled in some way. Out of these tires, around 130 million are used every year as tire-derived fuel, which is the biggest use for old tires.
68. 16 million tires are used each year as retreads.
Out of all discarded tires, over 16 million are reused as retreads (molding new rubber onto an old tire). This process is very useful because it uses much less oil and other resources than creating a new tire.
Around 56 million tires are used in civil engineering projects like roadway embankments.
69. There were 1.7 million tons of rubber from tires recycled in 2017, excluding rethreaded tires.
This makes up around 40.3% of the total amount of rubber in tires generated that year. But this estimate excludes retreaded tires or energy recovery from tires. The overall recycling rate for rubber in MSW was 18.3% in 2017.
70. Up to 75% of airspace in landfills is consumed by tires.
One of the most important facts about recycling tires is that they consume up to 75% of airspace in landfills.
Yet, landfills receive just around 5 million tons of MSW rubber and leather in 2017, which is only 3.5% of all MSW landfilled.
As for combustion for energy recovery, around 2.5 million tons of rubber and leather were combusted in 2017, which is 7.3% of the total.
Facts About Trash
71. The US is generating more than 30% of the planet’s total trash.
Currently, there are over 2,000 landfills open in the US. Most often, they are very well concealed. It seems they are here to stay, at least for the foreseeable future.
While it has only 4% of the world’s population, the US is generating nearly one-third of the planet’s total trash.
Data from 2014 shows that there were 258 million tons of trash discarded from homes, businesses, and institutions.
72. 30% of US trash is the packaging.
If you are wondering how much trash is recycled, the answer is not that good.
Nondurable goods like newspapers and clothing account for 20% of the US trash, yard trimmings account for 13.3%, and other organic materials are accounting for 14.9% of the US trash.
The rest of 20.4% consists of durable goods from homes and businesses, according to recycling trash facts. These durable goods include furniture and appliances, which can be repaired or repurposed or their materials recycled.
73. 28.2% of the US trash is food waste and trimmings, easily compostable trash.
Additionally, paper and paperboard account for 26.6%. According to trash statistics, plastics metals, and glass account for 26.3%.
Finally, rubber, wood, leather, and textiles account for the remainder of 15.7% of US trash, and they also can be recycled into some useful products.
74. 63,000 garbage trucks can be filled with trash every day in the US.
Every day, Americans generate enough trash to fill 63,000 garbage trucks. One of the most shocking trash facts is that the average American will leave behind around 90,000 pounds of trash over their lifetime.
A lot of trash is made while being a college student since they produce 640 pounds of solid waste each year, with around 500 disposable cups and 320 pounds of paper leading the way.
These numbers are even worse if you note that it takes 30 dollars to recycle a ton of trash, 50 dollars to send it to landfills, and 65-75 dollars to incinerate it.
75. The cost of recycling rose 4 times in some places after China’s ban on importing US recycled goods.
The shocking fact about recycling is a crisis in the US caused by China’s decision a couple of years ago to stop the import of US recycled goods.
This decision changed the scenery a lot, where recycling companies found that it is not cost-effective to recycle at old operating costs.
Recycling statistics for 2019 show that recycling companies have decided to charge a lot more.
This has made cities and towns reevaluate their recycling choices and find a new way to cope with this problem either by raising taxes or cutting other municipal services.
76. According to recycling costs statistics, it can cost between $50 and $150 per ton for a good curbside recycling program.
For comparison, trash collection and disposal programs cost between 70 and 200 dollars per ton. So recycling is cost-effective, but there is still plenty of room for improvement.
77. The average recycling contamination rate in the US is 25%.
According to the recycling contamination facts, it was closer to only 7% a decade ago. This is due to the fact that most recycling programs in the US are now single steam.
This has led to an increase from 29% to 80% of American communities covered.
Improving Recycling: Key Takeaways
Recycling represents one of the best ways to leave a positive effect on the environment, and by proxy, on us. We can save a lot of energy and create less waste by recycling rather than creating virgin products.
The facts show that an increase in wealth leads to more buying and more waste.
There are many facts on why recycling is important, like helping in reducing the pollution caused by waste and harmful chemicals in landfills, reducing the need for raw materials, preserving the forests, and slowing down global warming.
In order to improve recycling and help our environment, there are a couple of recycling tips and facts you should know and implement.
For example, aluminum and steel cans should be crushed flat in order to save more space. The same goes for cardboard boxes, which should be broken down and kept dry and free from food waste.
Recycling for kids facts reveals that another good way to improve recycling is educating kids about it. There are several ways to learn and encourage your kids to recycle.
You can educate them by telling them some fun facts about recycling for a start, making recycling bins in the house labeled Paper, Plastic, and Cardboard.
Additionally, you can teach your child about composting by deposing the food scraps in an outdoor container. When they are a little older, you can take them to the recycling center to see how the complete process works.
Why is recycling important is no longer a mystery. If we want to leave this planet for future generations, we have to step up with recycling. There is still a lot of room for improvement.
And although the US is currently struggling with recycling thanks to China’s ban on the import of recycled products, there is a positive trend in recycling.
While the rates are rising, we can still learn a lot from some European countries, which are doing a lot more.
As you can see from these recycling statistics, recycling is helping to reduce pollution, save energy, conserve resources, create jobs, and boost the economy. So, how often do you recycle? Let us know in the comments below. Till next time!
Frequently Asked Questions
According to a recent survey, 94% of Americans support recycling and 74% of them say it should be a priority. But, the national average recycling rate is only 34.7%. Another study reveals that 42% of Americans claim to always recycle, while 38% claim they do it as often as possible.
On the other side, we have 10% of Americans who recycle sometimes and 10% of Americans who never recycle.
The leading countries in the world by recycling rate are Germany and Austria with around 63% of recycling and composting their waste. The average rate for the European Union was around 43%, and the target for 2020 was 50% for all EU countries.
For example, South Korea issued legislation making composting food waste mandatory and deciding to pay for trash by weight. This action increased the nation’s recycling rate to over 83%, and it is still growing.
About 80% of what ends up in landfills in the US is recyclable, although the recycling rate is barely over one-third of the waste, making landfills one of the biggest contributors to soil pollution. Out of all solid waste in the US, 90% does not get recycled.
This waste contains around 36 billion aluminum cans with a scrap value of more than 600 million dollars, 28 billion bottles and jars, and 11 million tons of recyclable clothing, shoes, and textiles.
- CardBoardBalers
- C&EN
- EEB
- EPA
- EPA1
- EPA2
- EPA3
- EPA4
- EPA5
- EPA PDF
- Everyday-Green
- GlobalCitizen
- It’s Easy to Recycle
- Junkluggers
- National Geographic
- NSpackaging
- NYTimes
- Paper Recycles
- Waste Management
- NRDC
- PaperRecycles
- PaperRecycles1
- PaperRecycles2
- RecyclingBin
- RecyclingToday
- ReuseThisBag
- RubiconGlobal
- RubiconGlobal1
- Salon
- SCCMO
- Statista
- The Balance Small Business
- Totebagfactory
- WasteTodayMagazine
- WWF