
An average environmentally conscious individual could probably recite several plastic waste statistics in any given conversation to spread awareness about the material’s dangers to the planet.
Such a negative view of plastic did not always exist, though.
Undoubtedly, plastics have helped make a vast array of commodities more affordable, adding vitality to many economies.
The surge in plastic production over the decades has contributed to the prosperity of many people.
Unfortunately, the world’s plastic appreciation has turned into an addiction. What was once instrumental in conserving nature is now destroying the planet.
The global plastic waste generation statistics and facts below paint an inconvenient picture of our unhealthy dependence on this synthetic material.
Top Plastic Waste Stats & Facts: Editor’s Choice
- Nearly 300 million tonnes of plastic waste are produced every year.
- Plastic wastage is growing at an annual rate of 9%.
- The US is the world’s top generator of plastic waste.
- Around 70,000 microplastics are consumed by an average person each year.
- 1 million marine animals die due to plastic pollution every year.
- 75% of all plastic produced has become waste.
- It takes around 500-1,000 years for plastics to decompose.
- 73% of all litter on beaches worldwide is plastic.
- About 91% of plastic is not recycled.
General Plastic Waste Statistics
1. Nearly 300 million tonnes of plastic wastes are produced every year.
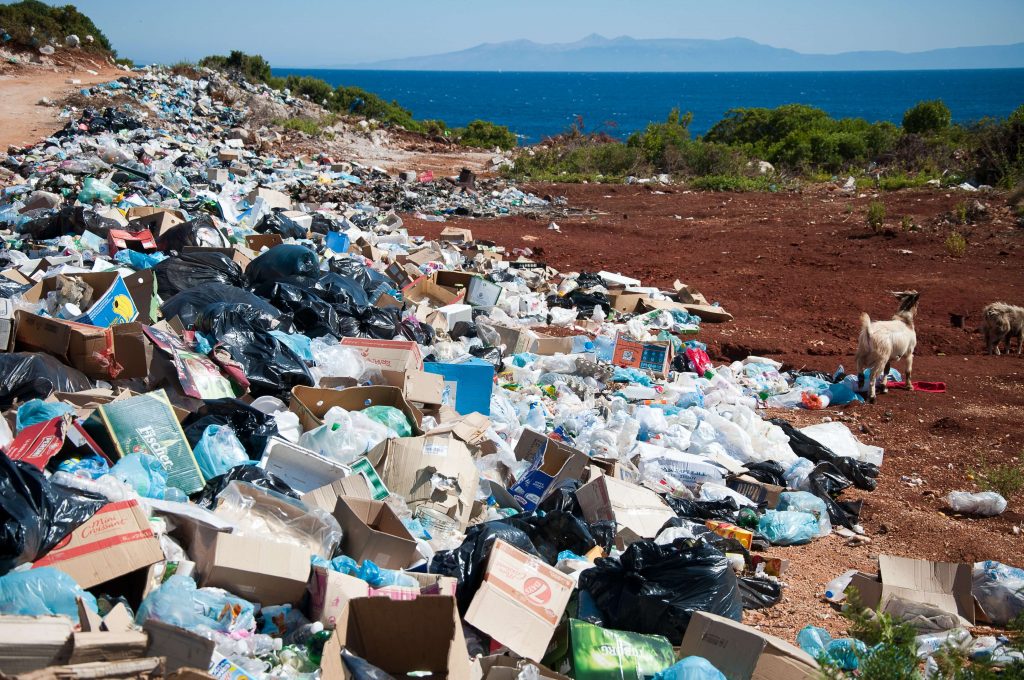
Between the 1950s and 1970s, plastic waste was manageable due to the relatively small amount of plastics. However, plastic production has skyrocketed in the following decades, and so does plastic wastes.
Currently, the world produces approximately 300 million tonnes of plastic wastes per year based on world plastic waste statistics. This almost equaled the combined weights of the total human population.
2. By 2040, there will be 1.3 billion tonnes of plastic wastes present in the environment.
As more plastics are produced globally, and only a tiny portion of this is recycled, this generates more plastic wastes.
As to the extent of the increase of plastic waste, statistics suggest there will be 1.3 billion tonnes of plastic garbage discarded on land and in bodies of water by 2040.
3. 10 million tons of plastic debris reach marine environments every year.
According to the plastic waste in the ocean stats, this is equivalent to more than one garbage truck of plastic thrown out into the seas per minute.
For this reason, many experts projected that plastics would outweigh the fish in the ocean by 2050.
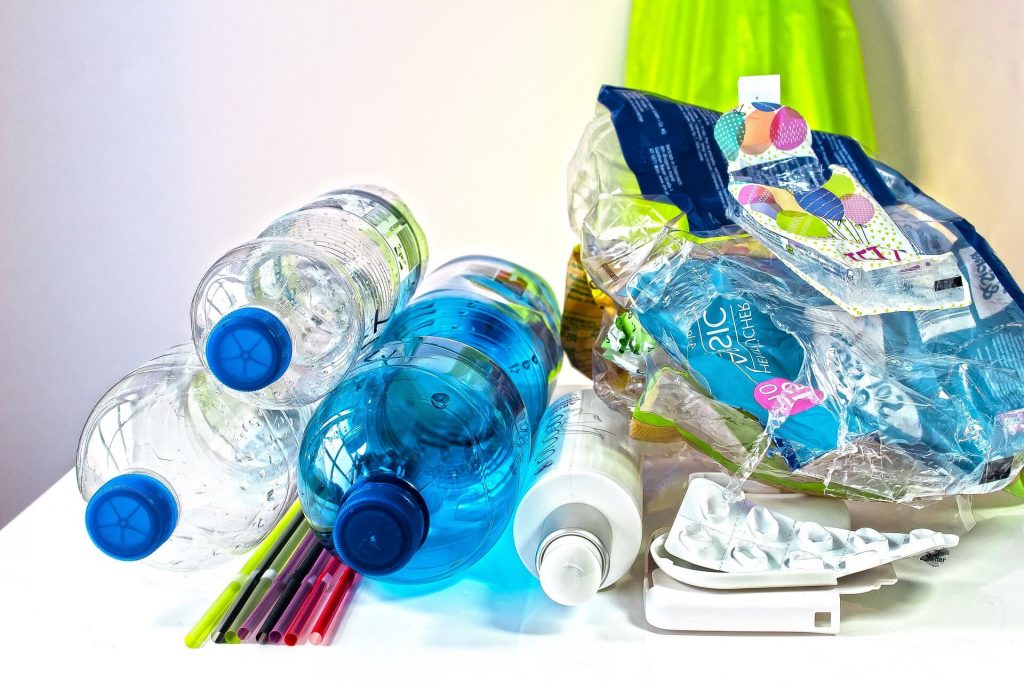
4. 50% of all plastics produced each year are single-use.
As its name implies, single-use plastic is used for a few minutes only and then thrown away.
Single-use plastic waste statistics show 380 million tons of single-use plastics (or 50% of the total plastic production) are made each year.
Since we use them only once, the same amount of plastic becomes trash in a year.
5. 40 billion plastic kitchen utensils are used and discarded each year.
Many kitchen utensils, such as spoons, forks, and knives, are plastic for easier disposal. Some thrilling plastic utensil waste statistics tell us that are 40 billion plastic spoons, forks, and knives are used and thrown away each year. Can you imagine how much of a waste these things make?
6. About 500 billion single-use plastic bags are used worldwide every year.
This is among the most concerning single-use plastic waste statistics ever recorded. Many parties are to blame, but shoppers and retailers deserve special mentions.
7. The number of plastic bottles used worldwide per day exceeds 100 million.
Plastic bottles are used everywhere and for various purposes. They serve as containers for many things like beverages, cosmetic products, pharmaceutical products, etc.
According to plastic bottles waste facts, the world uses more than 100 million plastic bottles used every single day.
8. Plastic wastage is growing at an annual rate of 9%.
Did you know the amount of plastic packaging thrown each year can circle the globe four times? You read it right!
And there’s going to be more as according to plastic packaging waste statistics, plastic wastage is growing at an annual rate of 9%.
9. Every single person uses more than 700 plastic bags per year.
That equals 160,000 bags used every second and 5 trillion for the entire year. Moreover, plastic bags waste statistics suggest that this total number of plastic bags can cover an area that’s double France’s size.

Intriguing US Plastic Waste Statistics
10. The US is the world’s top generator of plastic waste.
A recent study finds the US as the world’s number one generator of plastic waste. It’s also the third contributor to ocean plastic waste.
As far as the US plastic waste statistics by state are concerned, Michigan produces more waste than the other states. Its landfills had the highest amount of trash, accounting for over 62 tons per person.
11. More than 60 million plastic water bottles are thrown in the US each day.
America is the 20th-highest contributor to plastic pollution on Earth.
In terms of plastic water bottles alone, they throw away more than 60 million of them every single day, as the statistics on plastic water bottle waste show.
What’s more bothersome is that many litter the country’s streets, waterways, parks, and other areas.
12. There are 27 million tons of plastic in landfills in the US.
Landfills are considered the oldest form of waste disposal. The US Environmental Protection Agency or EPA plastic waste disposal statistics reveal that landfills contained 27 million tons of plastic in 2018.
That accounts for 18.5% of all municipal solid waste landfilled in the US.
13. The US generates more than 35 million tons of plastics but recycles just 8.3% of it.
According to the latest official statistics on plastic bottle waste, the country’s recycling rates for polyethylene terephthalate (PET) and high-density polyethylene (HDPE) bottles were 29.1% and 31.2%, respectively.
For a nation with the largest economy and represents only 4% of the global population but produces 12% of the municipal waste worldwide, America has to do more.
14. The US produced more than 14.5 million tons of plastic containers and packaging.
The latest US plastic waste statistics by type indicate that the country produced more plastic containers and packaging, with this category having the most plastic tonnage.
There are many types of plastic under this category, including bags, PET bottles, sacks, jars, wraps, and many other containers and packaging.
15. More than 2 million tons of plastic bottles are thrown in US landfills.
We said earlier that there are over 27 million tons of plastic in US landfills. According to the plastic water bottle waste statistics, more than two million of these are plastic water bottles.
With 1,000 Americans opening a bottle of water every second, this does not come as a surprise.
16. In 2018, every average individual in the US generated 4.9 pounds of municipal solid waste per day.
If there’s one particular thing an average person in the US can produce each day, it’s solid waste. The amount is 4.9 pounds, as the statistics about plastic waste per person indicate.
Multiplying that by the number of persons in the country and by the number of days in a year will result in 292.4 million tons of MSW generated the entire year.
Plastic Pollution Statistics: Their Adverse Effects
17. Australia’s bottled water industry, worth over half a billion dollars, generates more than 60,000 tons of greenhouse gas emissions every year.
This is the same level of air pollution 13,000 cars can emit over 12 months. This is perhaps one of the facts about human health and plastic waste that has yet to enter the public consciousness.
18. Being able to last for up to 1,000 years means every plastic bag can kill numerous animals before it finally disappears.
Lengthy disintegration is a well-known plastic bag waste fact. For this reason, every piece of plastic debris could have countless casualties throughout its life span.
Once swallowed by a creature, the plastic will be re-released in the environment after its victim’s body decomposes. Then, the material can continue harming more wildlife for hundreds of years.
19. Around 70,000 microplastics are consumed by an average person each year.
According to a study showing plastic pollution waste statistics, this amount, if broken down, is equivalent to approximately 100 bits of microplastic in just a single meal.
No wonder even those who eat healthy foods develop serious illnesses. Those microplastics might be the culprit.
20. 1 million marine animals die due to plastic pollution every year.
Given the significant amount of plastic waste reaching the oceans per year, it’s not surprising how many marine lives they intoxicate and kill.
An alarming plastic waste stat specifies that one million marine animals die each year due to plastic waste pollution.
If this remains uncontrolled, the possibility of plastic waste outnumbering marine lives in the future is not far from happening.
21. On average, there are 325 microplastic particles present in one liter of bottled water.
A recent study uncovering some facts about plastic water bottles waste found that 93% of the 259 bottles of water tested contain microplastics.
Moreover, each liter of bottled water has an average of 325 microplastic particles. This means that drinking bottled water may not be entirely safe for humans, no matter how nice its packaging looks.
Some Plastic Waste Facts You May Not Know
22. The average working life of a plastic bag is 15 minutes.
This is the origin of many plastic bag waste statistics. Plastic bags are often used just once and then tossed.
Due to poor management, our trash is usually not recycled, which is why it eventually finds its way into the ocean, staying there for at least half a millennium.
Let that sink in for a minute.
23. In 2018, Collins Dictionary declared “single-use” word of the year.
This recognition is a testament to the troubling plastic shopping bag waste statistics.
The word usage increased fourfold between 2013 and 2018, which may also point to the increasing awareness about the world’s “single-use plastic” conundrum.
24. 75% of all plastic produced has become waste.
Statistics about plastic waste denote that three-fourths of all plastic ever produced is now garbage. This only means just 25% of this is being used.
If that’s the case, then plastics are made to serve their beneficial purposes less and pollute the environment more.
25. Half of all seabird species ingested sea debris.
Seabirds are among the most endangered bird species worldwide. It’s just disheartening that consuming plastic wastes contributes to their extinction.
Statistics on plastic waste affecting animals revealed facts that are hard to digest.
Accordingly, half of all seabird species are known to ingest sea debris. What’s worse, this number will escalate to 99% by 2050.
26. It takes around 500-1,000 years for plastics to decompose.
Here’s one of the crazy facts about plastic waste you may not be aware of – plastics stay way longer than humans do on Earth.
You and your generations may no longer be alive, but the plastics made yesterday and today will be there for up to a thousand years.
27. Unlike traditional plastic bottles that can take up to 1,000 years to biodegrade, edible water containers can harmlessly break down in six weeks.
Ooho!, Skipping Rocks Lab’s breakthrough product is perhaps the most exciting solution to one of the most undeniable plastic bottle waste facts.
28. Plastic bottles are the third most collected plastic trash on beaches in more than 100 counties.
During its annual beach cleanup drive, the Ocean Conservancy uncovered some plastic water bottle waste facts.
Accordingly, plastic bottles are the third most collected garbage item from beaches in more than 100 countries. With this result, the organization aims to ban plastic bottles next to plastic shopping bags.
Shocking Plastic Waste in the Ocean Facts & Statistics
29. China, Indonesia, the Philippines, Vietnam, and Sri Lanka together account for about 60% of all the plastic in the ocean.
Collectively, these five Asian nations are home to more than 1.9 billion people. Three of them belong to the 15 countries with the longest coastlines on the planet.
Regarding their contribution to plastic waste in oceans, facts and statistics show it’s about 60% in total.
30. 73% of all litter on beaches worldwide is plastic.
Beaches are undeniably one of the best places to relax and have fun. But reflecting on the amount of plastic waste in the ocean statistics tell us can be disheartening.
Beach litters worldwide are 73% plastic, comprising food wrappers, bottles, cigarette butts, grocery bags, etc.
31. There are around 200 million tonnes of plastic waste in the Atlantic Ocean.
Regarding the current amount of plastic waste in the Atlantic Ocean, stats show that the world’s second-largest ocean has an estimated 200 million tonnes. This is at least ten times more than previously believed.
32. In the United Kingdom, about 5,000 pieces of plastic waste per mile litter the beach.
If you walk on an average British beach, you will likely find more than 150 plastic bottles every mile. Plastic bottle waste management stats indicate that Europe scores the highest in terms of trash management. But the UK needs to do more.
33. 1 million seabirds and 100,000 turtles and marine mammals die due to plastic entanglement and ingestion every year.
Recent plastic waste stats showed that plastic pollution is affecting 100% of examined sea turtles. The same results were found in 59% of whales, 40% of seabird species, and 35% of seals.
34. The world’s five ocean gyres are causing millions of garbage pieces (most of which is plastic) to collect in one area due to current circulation.
Those tons of debris collected in the ocean have formed patches. The Great Pacific Garbage Patch is the largest of the five giant garbage patches.
Global plastic waste statistics show that it comprises nearly 1.8 trillion pieces of garbage. Such an amount can cover an area that’s double the size of Texas.
35. Over 90% of plastics in the oceans are brought by ten rivers alone; 8 are in Asia, and two are in Africa.
If you want to know more facts about plastic waste and where it comes from, pay attention to the rivers of Chang Jiang, Indus, Huang He, Hai He, Nile, Ganges-Brahmaputra-Meghna, Zhujiang, Amur, Niger, and the Mekong.
These water bodies serve as the world’s primary channels of plastic pollution from deep inland to vast marine environments.
36. By 2040, the amount of plastic waste in the ocean will triple.
One of the worrying facts about plastic waste many may not be aware of is that there will be 29 metric tons of plastic waste flowing into the oceans two decades from now.
The increase in plastic production will directly influence the rise in plastic waste pollution. This only suggests that environmental campaigns curb the issue with little progress.
Plastic Waste Recycling Stats
37. About 91% of plastic is not recycled.
Six decades of plastic mass production resulted in 6.3 metric tons of trash, only 12% of which has been incinerated.
The remaining 79% of plastic waste either sits idly in landfills or finds its way into the natural environment. Statistics on global plastic waste further indicate that only 9% of plastic is recyclable.
38. 90.5% of plastic waste ever made has never been recycled.
In 2018, the UK’s Royal Statistical Society made this stat of the year. Indeed, it is one of the shocking statistics about plastic waste out there.
39. Norway has the highest PET recycling rate of 97%.
Norway leads the world in recycling, having the highest polyethylene terephthalate (PET) recycling rate of 97%, PET plastic waste statistics show. The country attributes this achievement to its efficient deposit return scheme.
40. 100% of plastics will be recycled in France by 2025.
The French government has boldly committed to developing systemic solutions based on the dreadful facts on plastic waste.
In 2018, Brune Poirson, Secretary of State to the Minister for the Ecological and Inclusive Transition, said that the country’s circular economy roadmap is set to create new jobs and boost France’s competitiveness.
41. By 2050, landfill plastic waste will be 35,000x as heavy as the Empire State Building.
This statistic about plastic waste will become a reality if our recycling efforts don’t improve in the future.
Posterity will have to deal with at least 12 metric tons of plastic in landfills and face the consequences of such mountains of long-lasting litter.
42. South Africa has turned nearly 40,000 liters of plastic milk bottles into over 400 meters of roads.
The alarming plastic bottle waste statistics have inspired recyclers in the country to be more innovative.
Accordingly, they have been using pellets made from recycled HDPE to substitute for 6% of the asphalt’s bitumen binder. As a result, one ton of asphalt can contain up to 128 recycled milk bottles.
43. At least 1,200 convenience stores in Chile are promoting the use of reusable containers.
The Chile-based start-up Algramo uses vending machines to distribute bulk staples at affordable prices to communities.
It also promotes reusable containers to over 1,000 convenient stores nationwide, statistics of plastic waste disclosed. The start-up offers discounts on future purchases to customers who will bring the same plastic package.
44. Germany has the highest recycling rate of about 56%.
Somehow, Germany offers hope to a world drowning in garbage, thanks to its ability to recycle 56% of its waste, recycling stats confirm. The country effectively implements strict waste segregation rules to become a role model for recycling.
45. Only 14% of the world’s plastic waste is recycled.
There’s a vast amount of plastics produced each year, but only 14% of it goes to the recycling facilities. This means the remaining high percentage ended up in the environment. This results in about $80-120 billion losses per year.
In the US, the EPA plastic waste statistics reported that only 13.6% of the 14.5 million tons of plastic packaging and containers generated in 2018 were recycled.
Worldwide Plastic Waste Statistics & Regulatory Initiatives
46. At least 57 countries have joined the UN Environment Clean Seas campaign since 2017 and pledged to cut down their plastic footprint sooner rather than later.
Knowing how much plastic is in the ocean now, more and more world leaders have begun to do their share in addressing one of the most pressing environmental challenges of the 21st century.
Some countries have banned single-use plastics, while others have taken the initiative to build more recycling plants.
47. Kenya and some other countries have banned the use of plastics.
In 2017, Kenya proposed a law prohibiting plastic bags elsewhere in the country, a plastic waste fact that inspired other countries to follow.
Anyone caught violating this law may face imprisonment of up to four years or pay the amount of $40,000.
Meanwhile, countries such as France, China, Italy, and Rwanda have either banned, partially banned, or imposed a tax on single-use plastic bags.
48. Carlsberg’s traditional beer holders have become 76% less harmful to the environment after the company bid farewell to plastic multipack rings.
The Danish brewer has begun using holders with recyclable glue instead. While the global beer industry needs to step up its game to pull down the statistics on plastic waste, Carlberg’s sustainability shift may pressure its competitors to follow suit.
49. Sodexo has stopped using plastic bags and stirrers at its 13,000 locations.
The decision seeks to address the growing public concern regarding controversial plastic bag waste facts. The food service giant believes this move will easily prevent 245 million single-use items from ending up in landfills or natural environments.
Although Sodexo has yet to phase out plastic straws, the company has stopped offering them and started giving them by request only.
50. Red Lobster will prevent the use of 150 million plastic straws at its hundreds of restaurants every year beginning in 2020.
The seafood leviathan plans to offer eco-friendly alternatives as part of its social responsibility for driving down the problematic plastic waste issue.
Based on plastic straw waste statistics, this initiative will result in 150 million fewer plastic straws used in restaurants.
51. Disney’s ban on some single-use plastics eliminates the use of 175 million straws and 13 million stirrers at its theme parks and resorts every year.
Banning single-use plastics at Disneyland could reduce 175 million straws and 13 million stirrers being thrown as garbage per year, the US plastic waste facts suggest.
With this in mind, the entertainment behemoth plans to make its locations free of polystyrene cups and sell reusable shopping bags instead of disposable ones.
52. Implementing reusable systems in food ordering services helped reduce utensil use by 88%.
A key figure we can deduce from restaurant plastic waste statistics is the surge in single-use plastic packaging driven by the Coronavirus pandemic.
But a popular chain named Just Salad was able to find a way to reinstate zero waste policies into its online ordering platform.
That is to ask their customers if they want plastic utensils to go with their food orders. This resulted in a reduction of utensil use by 88% as well as saved the company money.
The Bottom Line
Indeed, the word plastic is not dirty but waste instead. Plastics have helped people and the economy in various ways.
However, people’s mismanagement of plastic wastes damages the environment, endangers wildlife, and poses threats to human lives.
The eye-opening statistics about plastic food packaging waste, single-use bags, plastic bottles, etc., have been knocking some sense into more and more of us.
Beating our plastic addiction will not happen overnight, but we are finally on the road to recovery.
Frequently Asked Questions
More than 300 million tons of plastic are made every 12 months. Half of the plastic we make are single-use products, which are destined to be used just for a few moments and then be discarded—but will last for many centuries.
The United Nations believes that anywhere between 60% and 90% of the garbage found littering the shorelines, floating on the surface, and reaching the seabed is plastic. Sooner or later, the problem will
come back to land and hurt us through seafood consumption.
Moreover, more than 800 marine species, including 15 classified as endangered, are affected by our inability to manage plastic trash effectively.
44% of all the plastics made in history were manufactured since the turn of the 21st century. Along with Canada and Mexico, the US has been responsible for only 18% of the world’s plastics, plastic waste statistics show. However, the plastic recycling rate of the US is just 9%.
Sources
- Beachapedia
- CNBC
- CNN
- Conservation
- EcoWatch
- Ellen MacArthur Foundation
- Fast Company
- Habits of Waste
- Healthy Human
- National Geographic
- National Geographic
- National Geographic
- National Geographic
- Oceana
- Plastic Recycling Library
- Protega
- Repurpose
- Royal Statistical Society
- Statista
- Statista
- Surfers Against Sewage
- SurferToday
- The Guardian
- The World Counts
- The World Counts
- United Nations Environment Programme
- United Nations Environment Programme
- US Environmental Protection Agency
- US Environmental Protection Agency
- World by Map
- World Economic Forum
- World Economic Forum
- World Economic Forum
- Worldometers
- Zero Waste Nest